-
TRADING
TRADING PLATFORM
Account type
Margin requirements
- TRADE RESOURCES
- INSTITUTIONAL SERVICE
- ABOUT

The first way to spot a possible breakout is to draw trend lines on a chart.
To draw a trend line, you simply look at a chart and draw a line that goes with the current trend.
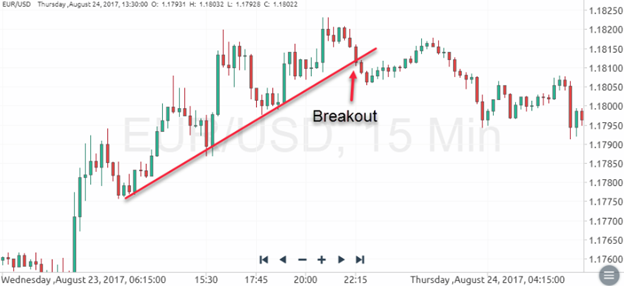
When drawing trend lines it is best if you can connect at least two tops or bottoms together. The more tops or bottoms that connect, the stronger the trend line.
So how can you use trend lines to your advantage? When the price approaches your trend line, only two things can happen.
The price could either bounce off the trend line and continue the trend.
The price could breakout through the trend line and cause a reversal.
We want to take advantage of that breakout!
Looking at the price is not enough however. This is where using one or more of the indicators mentioned earlier in this lesson could help you tremendously.
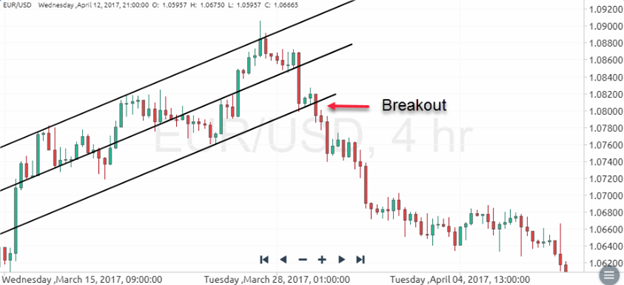
Another way to spot breakout opportunities is to draw trend channels.
Drawing trend channels are almost the same as drawing trend lines except that after you draw a trend line you have to add the other side.
Channels are useful because you can spot breakouts on either direction of the trend.
The approach is similar to how we approach trend lines in that we wait for the price to reach one of the channel lines and look at the indicators to help us make our decision.
When the price bounces off the upper and lower channel trendline, it’s only a matter of time when a breakout will occur. After the price breaks the channel, wait for the candlestick to close and enter a position in the direction of the breakout. The following chart shows how to trade a short position after the price breaks out of a channel.
The third way you can spot breakout opportunities is by looking for triangles.
Triangles are formed when the market price starts off volatile and begins to consolidate into a tight range.
Our goal is to position ourselves when the market consolidates so that we can capture a move when a breakout occurs.
There are 3 types of triangles: Ascending triangle; Descending triangle; Symmetrical triangle
Ascending triangles form when there is a resistance level and the market price continues to make higher lows.
It is easily recognized by a rising trend line intersecting with a flat resistance line. It is often regarded by traders as a bullish pattern characterized by a breaking out above resistance when completed. However, in the ascending triangle pattern, breakouts can take place below resistance. This can especially be the case when the trend prior to the triangle was down.
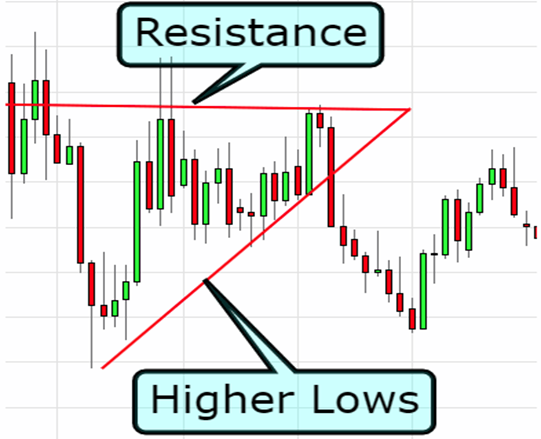
The story behind an ascending triangle is that each time the price reaches a certain high, there are several traders who are convinced about selling at that level, resulting in the price dropping back down.
On the other side, there are several traders who believe the price should be higher, and as the price begins to drop, buy higher than its previous low.
The result is a struggle between the bulls and bears which ultimately converges into an ultimate showdown…
What we are looking for is a breakout to the upside since ascending triangles are generally bullish signals. When we see a breach of the resistance level the proper decision would be to go long.
Descending triangles are basically the opposite of ascending triangles.
The triangle pattern represents the forces of buyers unable to push price higher and sellers struggling to push price lower. Usually, the struggle is resolved with a breakout below support
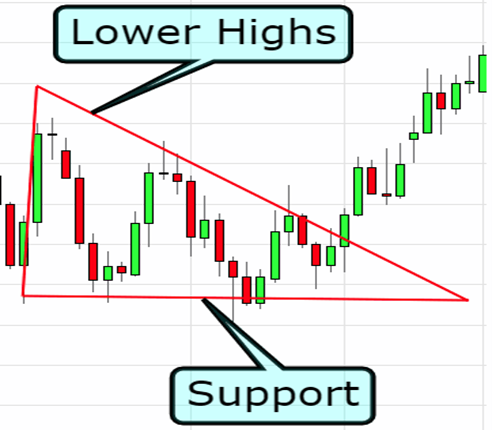
Descending triangles are generally bearish signals. To take advantage of this, our goal is to position ourselves to go short if the price should breakout below the support level.
The third type of triangle is the symmetrical triangle.
Rather than having a horizontal support or resistance level, both the bulls and the bears create higher lows and lower highs and form an apex somewhere in the middle.
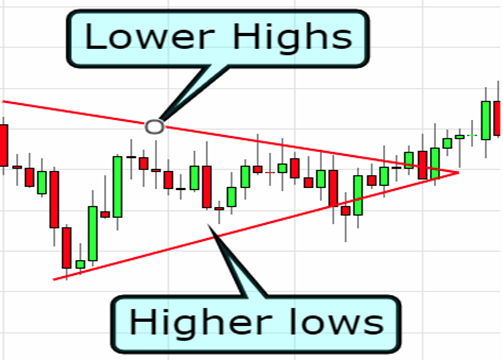
Unlike the ascending and descending triangles which are generally bullish and bearish signals, symmetrical triangles have NO directional bias.
This coiling of price between support and resistance is called a consolidation. Usually, within the first 2/3 of the triangle, a breakout occurs either above trendline resistance or below trendline support as either the sellers or buyers take control.
Once a triangle is identified on the chart, traders will wait for a breakout either above the resistance trendline or below support. After a breakout is confirmed with either a closed candle above resistance or below support a stop is placed approximately 10 pips below the last swing low of the triangle. A limit equal to the height of the triangle is then placed.
In the case of the symmetrical triangle, you want to position yourself to be ready for both an upside or downside breakout. A perfect time to use the one-cancels-the-other (OCO) order!
Ascending triangles usually breakout to the upside.
Descending triangles usually breakout to the downside.
Symmetrical triangles can break either to the upside or the downside.
*The information presented above is intended for informative and educational purposes, should not be considered as investment advice, or an offer or solicitation for a transaction in any financial instrument and thus should not be treated as such. Past performance is not a reliable indicator of future results.

Online Chat Chat with us
Email:supportsohomarkets.cc
Copyright © 2024 - All rights reserved.
Soho Markets Global Limited is an Investment Firm incorporated under the laws of Republic of Mauritius under number 181778 and registered address at Suite 803, 8th Floor, Hennessy Tower, Pope Hennessy Street,11328, Port Louis, Mauritius. Regulated by the Financial Service Commission (FSC) in Mauritius under license number GB21026599.
RISK WARNING: Soho Markets Global Ltd offers trading on Foreign Exchange (‘Forex or ‘FX) and Contracts for Difference (‘CFDs), which are complex financial products that are traded on margin. They carry a high level of risk since leverage can work both to your advantage and disadvantage. As a result, these products may not be suitable for all investors, as loss of all invested capital may occur. You should not risk more than you are prepared to lose. Before deciding to trade, you need to ensure that you understand the risks involved and consider your investment objectives and level of experience. Seek independent advice, if necessary.
Soho Markets Global Ltd does not issue advice, recommendations or opinions in relation to acquiring, holding or disposing of a CFD.
Soho Markets Global Ltd is not a financial advisor and all services are provided on an execution-only basis. This communication is not an offer or solicitation to enter into a transaction and shall not be construed as such.
This website is not directed at any jurisdiction and is not intended for any use that would be contrary to local law or regulation.
By using our you agree to use our cookies to enhance your experience.
Services are not available for residents of Turkey and United States of America
Telephone: +230 2146398
CLIENT AGREEMENT (TERMS AND CONDITIONS) Complaints or Grievances Policy Conflicts of Interest Policy Cookie Policy Order Execution Policy Privacy Policy Risk Disclosure